In understanding the system and flowrates, one more fact it worth exploring, variability.
Several times in previous text on flowrate the words "ON AVERAGE" were used (in all CAPS). Clearly, the annual inflow varies greately as compared to the long term (period of record) average.
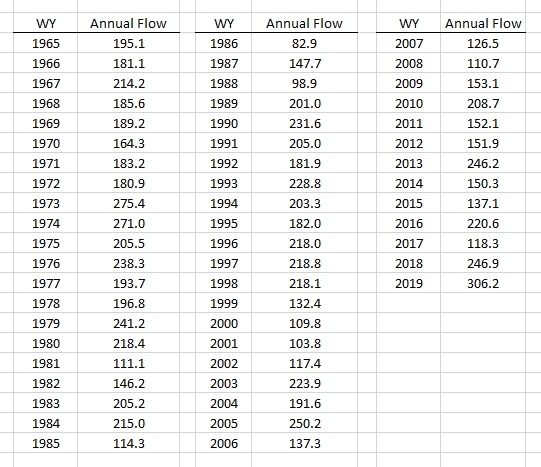
In fact, the period of record (1965 thru 2019) annual average for the USGS site just upstream of Burton is 184 cfs, with a minimum of 82.9 cfs (1986) and a maximum of 306.2 cfs (2019). So, the system is "real-time adjusted" to the extent possible, to minimize spilling water (water over the spillway rather than through the hydropower units) with this sort of variability relative to the maximum. And, with respect to the minimum, efforts are made to maximize the value of the products with respect to time-of-day generation.
The above narrative was based on average annual variability. Of course the project is operated on a day-to-day (even hour-to-hour) basis which has even more variability that must be addressed by the operators.
The year to year variability of average annual flow (cfs) is shown below. (Note: WY is "water year", Oct 1 to Sept 30 with the year that of Sept 30)